By now have probably heard of smog. Smog forms when primary pollutants such as nitrogen oxides (NOx), which are produced by burning fuels, and volatile organic compounds (VOCs) escape into the atmosphere. VOCs are unburned hydrocarbons produced by automobile fuel tanks, other chemicals from commercial enterprises, and natural sources such as trees. In the air, these chemicals react or combine with sunlight to produce a number of different materials, the most common of which is ozone (O3). Because of this, ozone is an example of a photochemical smog. This form of ozone is concentrated in the lower atmosphere (the troposphere), where it comes in contact with plants and humans. High levels of ozone can result in eye irritation and respiratory problems. Ozone can also damage plant leaves and slow growth.
In this activity, students measure ozone levels in and around their school using a chemically treated paper, called Eco™Filter. City smog is a serious global problem, and one worthy of investigation. You might visit the EPA Air Now link in the menu above.
Objectives
- Conduct experiments to determine levels and patterns of ozone in your local community.
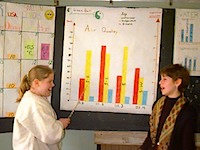
- Analyze the data and present it in graphical and map form.
- Use the Internet to share their ozone and weather data with other schools.
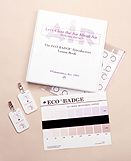
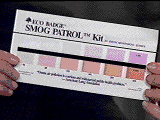
Eco™Filters (ozone test strips), graph paper, thermometers, psychrometers, Project Air Quality Recording Form. The images below show the tools for monitoring ground level ozone available from Vistanomics. On the left is the kit which contains 30 ozone test strips, a color chart (also shown in the center), and portable ozone monitors (shown to the right) which hold one test strip and can be worn clipped to clothing, or hung at a observation site. You should order these materials in advance of implementing Project Clean Air.


Ozone Observations and Measurements
1. To start off, what do you think would be the effect of a "Smog Alert" on the activities of people. What cities might be likely to have smog alerts? Why? What effect do they think temperature has on smog? Discuss smog with the students, and point out that the main component of smog is ozone.
In this activity you are going to study ground-level ozone in your local community. This might be the area around your school, or it might include various locations in your community. To do this you are going to set up some monitoring sites (for example your backyard, or a park near your house would be a suitable site), and then collecft data on ozone levels over a period of time. This will be decided upon in consultation with your peers and your teacher.
2. Below is a picture of an Eco™Filter, which is a small strip of filter paper that has been treated with a chemical that will turn the paper a shade or purple or brown. Notice that the strip has two circles. The upper circle will react to ozone so that in one hour it turns a shade of violet, while the other circle will change color over an eight-hour period and turns a shade of brown. We will refer to the Eco™Filter as an ozone test strip. You will use a chart similar to the one shown below to interpret the ozone level when you do your experiments.


Five Test Strips are shown above. The top circle will turn a purple color within an hour, while the bottom circle will turn a shade of brown over an 8-hour period.
3. How the ozone test strips are used. Tape the ozone test strips on a small index card. Since the chemical works when it is exposed to the air, you must work quickly. If you are going to do a one-hour test, you should cut the strips and use only the top part of the strip (the one-hour test circle). This should be taped to the card. When you place the card in the monitoring location, you should record the temperature, humidity, cloud cover, cloud type, visibility, and weather. Use the Project Ozone Recording Form |
|
4. Monitor ozone on school grounds or at home using the schedule you have agreed upon with your teacher and peers. Be sure to record quantitative and qualitative data each day. The observations should be recorded on a class chart and in a data table in the computer.
Interpreting Ozone Observations
To read the strips, the color on the ozone test strip should be compared to the Eco Badge® Colorimetric Chart (as shown)

To interpret the meaning of the ozone level, share the data in the ozone conversion table below. The U.S. EPA has established 120 parts per billion of ozone as the optimal level allowable by law. That is, if a reading exceeds 120 ppb (even for one day), then that community is not in compliance. Naturally, some cities have a more serious problem than others. For example, these cities were above the smog level standards an average of the following number of days per year: Los Angeles (155); New York (20); Houston (20); Atlanta (5); Fresno, CA (21); and Bakersfield, CA (29).
Air Quality |
Good |
Moderate |
Unhealthful |
1st Stage Alert |
2nd Stage Alert |
PPB on Eco™Filter |
10 - 50 |
50 - 150 |
100 -250 |
250 -350 |
>350 |
Part per billion |
<60 |
60 - 120 |
120 - 190 |
190 - ;340 |
>340 |
Ozone Index reported to public. (ozone level/120 X100) |
50 |
50 -100 |
100 - 150 |
150 - 280 |
>280 |
Extensions
1. Ozone forecasting. After you have completed this activity, visit the Ozone Forecasting page, and see if you can forecast ozone over the next few days. You might also look at EPA'sAirData Site to learn more about monitoring of ground-level ozone and other air pollutants.
2. Use the EPA Air Quality Website, Air Now, or EPA Health Effects Page to find answers to these questions about ozone:
1. What is ground-level ozone?2. Why are we concerned about ground-level ozone?
3. Who is most at risk from exposure to ozone?
4. How does ground-level ozone harm the environment?
5. What improvements would result from the EPA's new standards?
6. What is the ozone hole and how is it related to ground-level ozone?


